How to Use PERT charts in CPM Scheduling

About PERT CPM charts
Managers nowadays have many tools at their command to schedule, organize, and coordinate activities within a project. To simplify the planning process and to schedule a multitasked project, they now make use of CPM and PERT methods. PERT is a Project Evaluation and Review Technique developed in 1950s by the U.S. Navy. It is a graphical presentation of schedule and inter-dependencies of all the activities in a project. It is used to plan and track all the tasks associated with a project in a specific period.
The PERT chart is actually a network diagram of the ongoing project and looks similar to a CPM graphic. CPM has its focus on the critical path activities to adhere to the time span allotted to each task of the project. But PERT is the visual representation of the relationships that exist between various activities of the project on the field. It points out to the task dependencies in its schedule. The combination of these two project-planning tools later became PERT CPM.
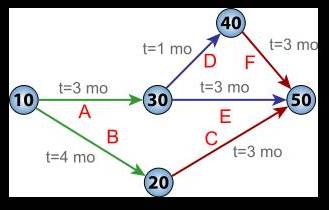
The PERT CPM chart facilitates decision-making. It is extensively used in the projects involving software development, building construction, automobile production, etc. Its project chart looks something like this:

Courtesy: wikipedia
As the figure points out, the PERT chart is actually a statistical tool consisting of activities/tasks and milestones in a multidimensional project. The numbered circles here represent milestones and the arrow lines represent series of tasks. The symbol ‘t’ here denotes the expected time required to complete a task. It is computed using the formula: TE = O+4M/6 where ‘TE’ stands for the completion time of the event, ‘O’ stands for Optimistic Time Estimate, ‘M’ is the normal time estimate and ‘P’ represents the pessimistic time estimate of the project
How to Use PERT CPM Charts
PERT assists the project managers better in software design and construction activities where time is a major factor rather than the cost. Designing a PERT chart and practically using it alongside the CPM schedule, does need skills and thorough mastery of project planning. There are steps involved in the design, use and implementation of PERT CPM charts in the project. The PERT methodology is used and monitored until the project is completed. The process needs following activities:
- Identify the tasks needed for the success of the project.
- Number and list all these tasks.
- Determine the amount of work necessary to complete each task.
- Identify and calculate the duration required to complete individual tasks. Estimate how long an activity can take to deliver result.
- Assign a fixed duration to each task.
- Assign start and end dates to each activity of the project.
- Create a sequence of events in order of priority, dependency and duration to capture parallel relationships among all the tasks.
- Draw a PERT CPM chart by connecting the sequenced activities with the help of lines and arrows – on paper or using software such as Microsoft Project.
- Clearly mark out the ‘start date’ and ‘end date’ of each activity of the project on the chart.
- Calculate the project completion time ‘TE’ using the PERT formula and mark it out on the chart. It now gives you a fair idea where your project stands, what pace it’s crawling at, delays if any and
- Finally, identify the critical path of the project and specify activities that need focus for project completion on time.
Punctually beginning the project activity on its assigned start date helps to avoid delays and assists in completion of the entire project on schedule. Use of the PERT CPM lets the managers achieve this in the scheduled duration and saves cost.
